Difference between revisions of "Significance of E. Coli Evolution Experiments"
m |
(see talk) |
||
| Line 273: | Line 273: | ||
|} | |} | ||
| − | + | ==Caveat== | |
| + | The chi-square test p-values are computed by comparing the test statistic to the chi-square distribution. The chi-square statistic diverges from the chi-square distribution unpredictably as n approaches zero and as expected cell frequencies approach zero. However, there is no single consensus about what minimum expected cell frequency is necessary or how many expected values need to cross that threshold. Most authors suggest that the minimum expected cell frequency is five | ||
| + | <ref>http://www.ling.upenn.edu/~clight/chisquared.htm</ref> | ||
| + | <ref>http://www.graphpad.com/www/Book/Choose.htm</ref> | ||
| + | <ref>http://books.google.com/books?id=bmwhcJqq01cC&pg=PA494&lpg=PA494&dq=chi-square+independent+categories&source=bl&ots=I9KXRYU_pe&sig=Ru8Qi3ApGT_ST5yxNSRhySg3l94&hl=en&ei=DufMSczSNurxnQfihPjkCQ&sa=X&oi=book_result&resnum=7&ct=result#PPA494,M1</ref> | ||
| + | <ref>http://www.uwlax.edu/faculty/toribio/math442_spr08/chi_square_gof_test_442.pdf</ref> | ||
| + | <ref>http://academic.reed.edu/psychology/RDDAwebsite/spssguide/chisquare.html</ref> | ||
| + | , although others suggest that some values may be as low as but not lower than one if 80% of cell values are greater than five; or that the minimum value may be as small as 5r/s where r is the number of expected cells with values less than five and s is the total number of expected cells. | ||
| + | <ref>http://faculty.chass.ncsu.edu/garson/PA765/chisq.htm</ref> | ||
| + | <ref>http://www.physics.csbsju.edu/stats/contingency.problem.html</ref> | ||
| + | <ref>Cochran, William G. Some Methods for Strengthening the Common [Chi-Squared] Tests, ''Biometrics'' Vol 10, No. 4 (Dec 1954) pp. 417-451</ref> | ||
| + | <ref>Yarnold, James K. The Minimum Expectation in [Chi-Squared] Goodness of Fit Tests sand the Accuracy of Approximations for the Null Distribution, ''Journal of the American Statistical Association'', Vol. 65, No. 330 (Jun 1970), pp. 864-886</ref> | ||
| + | <ref>http://books.google.com/books?id=3XuUx2OSPIQC&pg=PA153&lpg=PA153&dq=chi+square+conservative+false+null+hypothesis&source=bl&ots=lyErIRWnUH&sig=ov44qNSEik0hXrJnzwkKXhVta08&hl=en&ei=sPfMSYzREcffnQf709nMCQ&sa=X&oi=book_result&resnum=9&ct=result</ref> | ||
| + | While different authors set different lower cutoffs, the data in the Blount experiment, where all expected cells have values less than one, lie below even the most liberal cutoff. For low n and expected cell counts, the chi-square test becomes increasingly conservative and errs on the side of accepting a false null hypothesis. | ||
| + | |||
| + | Separate from the issue of low cell counts, the chi-square test also assumes and requires that the data for all categories are completely independent and mutually exclusive: that no member of the population under study can contribute to more than one cell. The chi-square test is therefore not to be used, for example, to study the status of the same population of patients before and after treatment, or to follow the characteristics of a single group over time. <ref>http://faculty.chass.ncsu.edu/garson/PA765/chisq.htm</ref> | ||
| + | <ref>http://books.google.com/books?id=bmwhcJqq01cC&pg=PA494&lpg=PA494&dq=chi-square+independent+categories&source=bl&ots=I9KXRYU_pe&sig=Ru8Qi3ApGT_ST5yxNSRhySg3l94&hl=en&ei=DufMSczSNurxnQfihPjkCQ&sa=X&oi=book_result&resnum=7&ct=result#PPA494,M1</ref> | ||
| + | <ref>http://davidmlane.com/hyperstat/B155670.html</ref> | ||
| + | The Blount experiment collects data from the same population of bacteria over a long period of time; this does not satisfy the conditions of the chi-square test. If the Blount experiment could be repeated so as to produce large n and large expected cell frequencies, the chi-square test would still be an inappropriate test to apply to the data for this reason. | ||
==References== | ==References== | ||
<references/> | <references/> | ||
Revision as of 16:33, March 27, 2009
Blount, Borland, and Lenski[1] claimed that a key evolutionary innovation was observed during a laboratory experiment. That claim is false. The claim was based on incorrect measurements of statistical significance. Rather than using a test from the statistics literature, a flawed test was contrived and used to measure significance. The flawed test (“mean mutation generation”) produced artificially low p-values.
Contents
Test Statistics
The test statistic used in Blout, Borland, and Lenski was mean mutation generation. For example, the experiment one mean mutation generation is (see Tables 1 and 2 of the paper)

The null hypothesis from the paper was constant mutation rate over all generations. However, measurements of mean mutation
generation can fail to observe deviations from that null
hypothesis. Consider an experiment where the mutation
probabilities for generations 1, 2, and 3 are  ,
,  , and
, and
 , respectively. If the mutation probabilities per generation
are
, respectively. If the mutation probabilities per generation
are  , then the mean mutation generation is 2.
However, if the mutation probabilities are
, then the mean mutation generation is 2.
However, if the mutation probabilities are 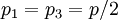 and
and
 , then the mean mutation generation is still 2. In the
latter example the experiment has deviated from the null
hypothesis, but the mean mutation
generation is insensitive to the
change. Because this test can fail to observe deviations from the null hypothesis, levels of statistical significance computed using this test (p-values) are meaningless.
, then the mean mutation generation is still 2. In the
latter example the experiment has deviated from the null
hypothesis, but the mean mutation
generation is insensitive to the
change. Because this test can fail to observe deviations from the null hypothesis, levels of statistical significance computed using this test (p-values) are meaningless.
If the trials from an experiment have two outcomes (e.g. success or failure), then the chi-square test for independence can be written

where  is the number of successes (e.g. mutations) in the i-th experiment,
  is the number of trials in the i-th experiment, and

is the fraction of trials that are successful in the all experiments. The chi-square test is, on average, at a minimum when all success probabilities are equal ( for
for  ) and will, on average, increase whenever the data follows any other hypothesis (
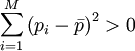 where
where  is the mean of the success probabilities). Thus the chi-square test is an effective hypothesis test for the data and hypotheses from Blount et al.
Experiment One Data
The data from experiment one of the paper is shown below (see Table 1 of the paper). The expected outcomes under the null hypothesis (no evolutionary innovation occurs) are also shown.
| Generation | Trials | Mutants | Statics | Expected Mutants | Expected Statics |
|---|---|---|---|---|---|
| 0 | 6 | 0 | 6 | 0.333 | 5.667 |
| 10000 | 6 | 0 | 6 | 0.333 | 5.667 |
| 20000 | 6 | 0 | 6 | 0.333 | 5.667 |
| 25000 | 6 | 0 | 6 | 0.333 | 5.667 |
| 27500 | 6 | 0 | 6 | 0.333 | 5.667 |
| 29000 | 6 | 0 | 6 | 0.333 | 5.667 |
| 30000 | 6 | 0 | 6 | 0.333 | 5.667 |
| 30500 | 6 | 1 | 5 | 0.333 | 5.667 |
| 31000 | 6 | 0 | 6 | 0.333 | 5.667 |
| 31500 | 6 | 1 | 5 | 0.333 | 5.667 |
| 32000 | 6 | 0 | 6 | 0.333 | 5.667 |
| 32500 | 6 | 2 | 4 | 0.333 | 5.667 |
| Total | 72 | 4 | 68 | 4 | 68 |
When the flawed test is used to compute the significance of this data, the p-value is 0.0085 (see Table 2 of the paper). This p-value is considered statistically significant. However, when the data is analyzed using a standard method (the chi-square test) the p-value is 0.19. This p-value is much larger than the one from the paper and indicates that there is no reason to reject the null hypothesis. The chi-square test p-value for experiment two is small (0.0004). However, experiment three is not statistically significant because its p-value is 0.22.
The chi-square test is a common statistical method.[2] It can be implemented in Microsoft Excel. If the numbers from the last four columns of the experiment one data table (excluding the “totals” row) are entered into Excel in rows 1-12 and columns A-D, then the p-value can be computed by entering “=CHITEST(A1:B12,C1:D12)” into any empty cell of the spreadsheet.
Experiment Three Data
The experiment three data from Blount et al. is shown in the table below. The expected numbers of mutants under the null hypothesis (constant mutation rate) is also shown.
| Generation | Trials | Mutants | Statics | Expected Mutants | Expected Statics |
|---|---|---|---|---|---|
| 0 | 200 | 0 | 200 | 0.571 | 199.429 |
| 10000 | 200 | 0 | 200 | 0.571 | 199.429 |
| 20000 | 200 | 0 | 200 | 0.571 | 199.429 |
| 25000 | 200 | 0 | 200 | 0.571 | 199.429 |
| 27500 | 200 | 2 | 198 | 0.571 | 199.429 |
| 29000 | 200 | 0 | 200 | 0.571 | 199.429 |
| 30000 | 200 | 2 | 198 | 0.571 | 199.429 |
| 30500 | 200 | 0 | 200 | 0.571 | 199.429 |
| 31000 | 200 | 0 | 200 | 0.571 | 199.429 |
| 31500 | 200 | 0 | 200 | 0.571 | 199.429 |
| 32000 | 200 | 1 | 199 | 0.571 | 199.429 |
| 32500 | 200 | 1 | 199 | 0.571 | 199.429 |
| Total | 2800 | 8 | 2792 | 8 | 2792 |
Comparison of p-Values
The following table compares the p-values reported in Table 2 of Blount et al. to the chi-square p-values for the same experiments. For experiments one and three, the chi-square p-values are much larger than the "mean generation" test p-values from the paper.
| Experiment 1 | Experiment 2 | Experiment 3 | |
|---|---|---|---|
| p-Value from Paper | 0.0085 | 0.0007 | 0.082 |
| Chi-square p-value | 0.19 | 0.0004 | 0.22 |
Caveat
The chi-square test p-values are computed by comparing the test statistic to the chi-square distribution. The chi-square statistic diverges from the chi-square distribution unpredictably as n approaches zero and as expected cell frequencies approach zero. However, there is no single consensus about what minimum expected cell frequency is necessary or how many expected values need to cross that threshold. Most authors suggest that the minimum expected cell frequency is five [3] [4] [5] [6] [7] , although others suggest that some values may be as low as but not lower than one if 80% of cell values are greater than five; or that the minimum value may be as small as 5r/s where r is the number of expected cells with values less than five and s is the total number of expected cells. [8] [9] [10] [11] [12] While different authors set different lower cutoffs, the data in the Blount experiment, where all expected cells have values less than one, lie below even the most liberal cutoff. For low n and expected cell counts, the chi-square test becomes increasingly conservative and errs on the side of accepting a false null hypothesis.
Separate from the issue of low cell counts, the chi-square test also assumes and requires that the data for all categories are completely independent and mutually exclusive: that no member of the population under study can contribute to more than one cell. The chi-square test is therefore not to be used, for example, to study the status of the same population of patients before and after treatment, or to follow the characteristics of a single group over time. [13] [14] [15] The Blount experiment collects data from the same population of bacteria over a long period of time; this does not satisfy the conditions of the chi-square test. If the Blount experiment could be repeated so as to produce large n and large expected cell frequencies, the chi-square test would still be an inappropriate test to apply to the data for this reason.
References
- ↑ http://www.pnas.org/content/105/23/7899.full.pdf
- ↑ Mathematical Statistics with Applications by Wackerly, Mendenhall, and Scheaffer, Section 14.4.
- ↑ http://www.ling.upenn.edu/~clight/chisquared.htm
- ↑ http://www.graphpad.com/www/Book/Choose.htm
- ↑ http://books.google.com/books?id=bmwhcJqq01cC&pg=PA494&lpg=PA494&dq=chi-square+independent+categories&source=bl&ots=I9KXRYU_pe&sig=Ru8Qi3ApGT_ST5yxNSRhySg3l94&hl=en&ei=DufMSczSNurxnQfihPjkCQ&sa=X&oi=book_result&resnum=7&ct=result#PPA494,M1
- ↑ http://www.uwlax.edu/faculty/toribio/math442_spr08/chi_square_gof_test_442.pdf
- ↑ http://academic.reed.edu/psychology/RDDAwebsite/spssguide/chisquare.html
- ↑ http://faculty.chass.ncsu.edu/garson/PA765/chisq.htm
- ↑ http://www.physics.csbsju.edu/stats/contingency.problem.html
- ↑ Cochran, William G. Some Methods for Strengthening the Common [Chi-Squared] Tests, Biometrics Vol 10, No. 4 (Dec 1954) pp. 417-451
- ↑ Yarnold, James K. The Minimum Expectation in [Chi-Squared] Goodness of Fit Tests sand the Accuracy of Approximations for the Null Distribution, Journal of the American Statistical Association, Vol. 65, No. 330 (Jun 1970), pp. 864-886
- ↑ http://books.google.com/books?id=3XuUx2OSPIQC&pg=PA153&lpg=PA153&dq=chi+square+conservative+false+null+hypothesis&source=bl&ots=lyErIRWnUH&sig=ov44qNSEik0hXrJnzwkKXhVta08&hl=en&ei=sPfMSYzREcffnQf709nMCQ&sa=X&oi=book_result&resnum=9&ct=result
- ↑ http://faculty.chass.ncsu.edu/garson/PA765/chisq.htm
- ↑ http://books.google.com/books?id=bmwhcJqq01cC&pg=PA494&lpg=PA494&dq=chi-square+independent+categories&source=bl&ots=I9KXRYU_pe&sig=Ru8Qi3ApGT_ST5yxNSRhySg3l94&hl=en&ei=DufMSczSNurxnQfihPjkCQ&sa=X&oi=book_result&resnum=7&ct=result#PPA494,M1
- ↑ http://davidmlane.com/hyperstat/B155670.html
See Also
http://www.sciencenews.org/index/feature/activity/view/id/40006/title/Molecular_Evolution
http://sciencenews.org/view/generic/id/40649/title/FOR_KIDS_Hitting_the_redo_button_on_evolution
http://www.conservapedia.com/index.php?title=Flaws_in_Richard_Lenski_Study&action=submit